Continuous Integration Workflow for Evaluating a Fuzzer
Fuzz testing (fuzzing) allows developers to detect bugs and vulnerabilities in code by automatically generating defect-revealing inputs. Most fuzzers operate by generating inputs for applications and mutating the bytes of those inputs, guiding the fuzzing process with branch coverage feedback via instrumentation. We recently developed a novel fuzzer for Java-based software, CONFETTI.
Developing and testing a fuzzer is hard: a small change to the tool might have an unexpected impact on its performance, and executing an evaluation campaign is typically a manual, error-prone process. An evaluation campaign typically involves deploying the tool to some cloud computing resources, running it, monitoring its execution, collecting the resulting log files and output, and then analyzing those results. If there is an error, the whole evaluation infrastructure must be torn down (to avoid incurring additional costs) and then a debugging effort must begin. On-boarding new students to these infrastructure tasks is a challenge, and sharing these scripts so that external researchers can extend research tools and reproduce a similar-scale evaluation is nearly-impossible.
For CONFETTI, we developed a CI workflow to automate the tool’s evaluation, conducting small-scale “smoke test” evaluations on each commit, and simplifying the process of invoking large-scale evalautions to a single button press. Fast feedback on changes to large, complex systems like a fuzzer makes a tremendous difference when it comes to finding and fixing bugs. For example, we found this artifact particularly useful when we used it in preparation of a pull-request that we provided to the upstream maintainers of the baseline fuzzer that we built upon, JQF. Since the workflow automatically generates reports that compare performance across branches, performance improvements (or regressions) are instantly visible.
Our template workflow defines the steps to conduct the evaluation, which is parameterized over the number of trials to conduct, the duration of each campaign, and the list of branches to include as comparisons in the final report. The workflow consists of the following jobs:
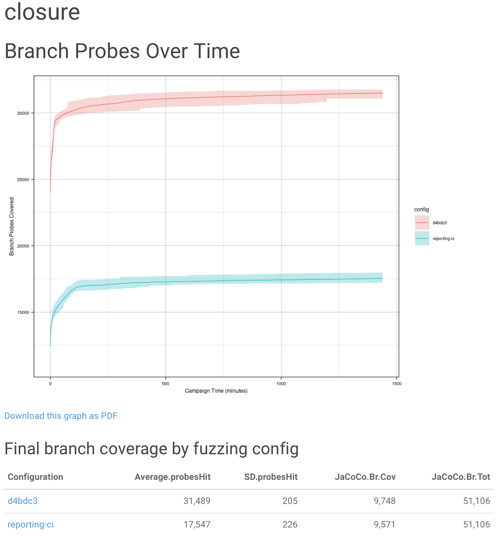
build-matrix- Creates a JSON build matrix that outputs all of the fuzzing tasks to run, one for each desired repetition of each fuzz targetrun-fuzzer- For each trial defined bybuild-matrix,run-fuzzerwill run the fuzzer and archive the results. If provided with a server address and access token, therun-fuzzertask will also start a telegraf monitoring agent, which will stream statistics from the machine running the fuzzer to a central database. We found this monitoring to be extremely useful to, for example, monitor overall machine memory usage, and visualize the aggregate performance of each fuzzing run while they were underway.repro-jacoco- Collect all of the results from each of the fuzzing runs, and reproduce the entire fuzzing corpus with JaCoCo instrumentation in order to collect final branch coverage resultsbuild-site- Invokes knitr to build an HTML and an MD report using the jon-bell/fuzzing-build-site-action,
We are happy to execute this workflow on our infrastructure for researchers who make pull requests on CONFETTI, and we are also excited to work with maintainers of other tools (like rohanpadhye’s JQF) to bring continuous evaluation workflows into the wider community and develop best practices for their design and maintenance.